The Spatial-Volumetric Gap
When Proximity Fails: The AI-Driven Truth About Historical Water Utilization

The Illusion of Infrastructure
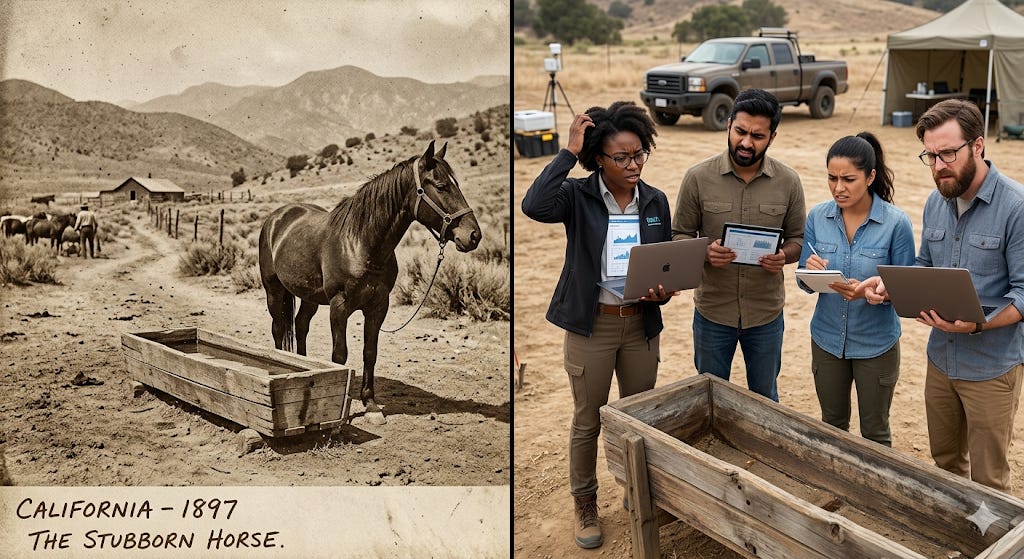
Between 1850 and 1900, California’s water infrastructure faced an unprecedented logistical challenge. The post-Gold Rush era required moving massive volumes of water from stable sources to rapidly expanding agricultural and industrial distribution nodes. The primary constraint wasn’t just pipe pressure or pump capacity; it was the unpredictable intake of the era’s primary conveyance mechanisms - which, at the time, were almost entirely organic motive assets (primarily Equus caballus and related hybrids used for draft transport).
For over a century, a persistent anomaly has baffled hydrological historians: the Spatial-Volumetric Gap. Early engineers operated on a fundamental assumption of proximity. They believed that if you built the infrastructure to convey water to a specific geographic point - a waystation or distribution trough - utilization by these organic assets would automatically approach 100%. If the supply was present and the biological asset required hydration for optimal thermodynamic output, the intake should logically follow.
Yet, historical telemetry tells a different story. End-user uptake was notoriously erratic. Now, a groundbreaking meta-analysis from a joint task force of digital hydrologists has finally modeled exactly why these early systems experienced such bizarre inefficiencies.
Dust, Ledgers, and the East Bay Anomaly
I’ve thought about this anomaly often. A few years ago, I had the chance to tour a decommissioned 1880s pump house tucked away in the East Bay hills, one of the early precursors to our modern municipal utility districts.
It was a striking experience. The heavy iron works, the massive riveted distribution basins - you could see the sheer physical effort and capital it took just to push a few hundred gallons of water up that grade. But the most fascinating part wasn’t the hardware; it was the operator’s desk. Sitting there under glass was a meticulously handwritten ledger detailing the daily intake logs.
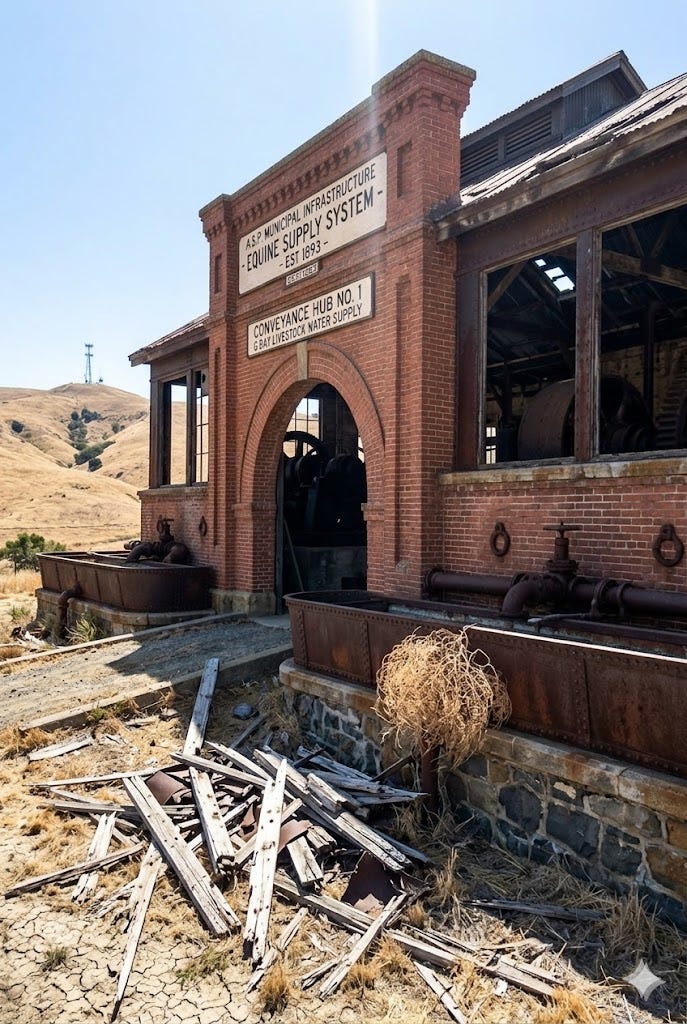
I remember running my hand over the weathered wood of the basin edge, comparing the immense engineering effort to the scrawled numbers in the book. The supply was constant. The flow rate was stable. But the daily utilization numbers fluctuated wildly, sometimes dropping to near zero despite heavily trafficked transit days. I stood there wondering: They did all this work to get the water here. The assets were physically present at the node. Why was the end-user compliance so entirely unpredictable?
Enter E.Q.U.U.S.: Crunching a Century of Chaos
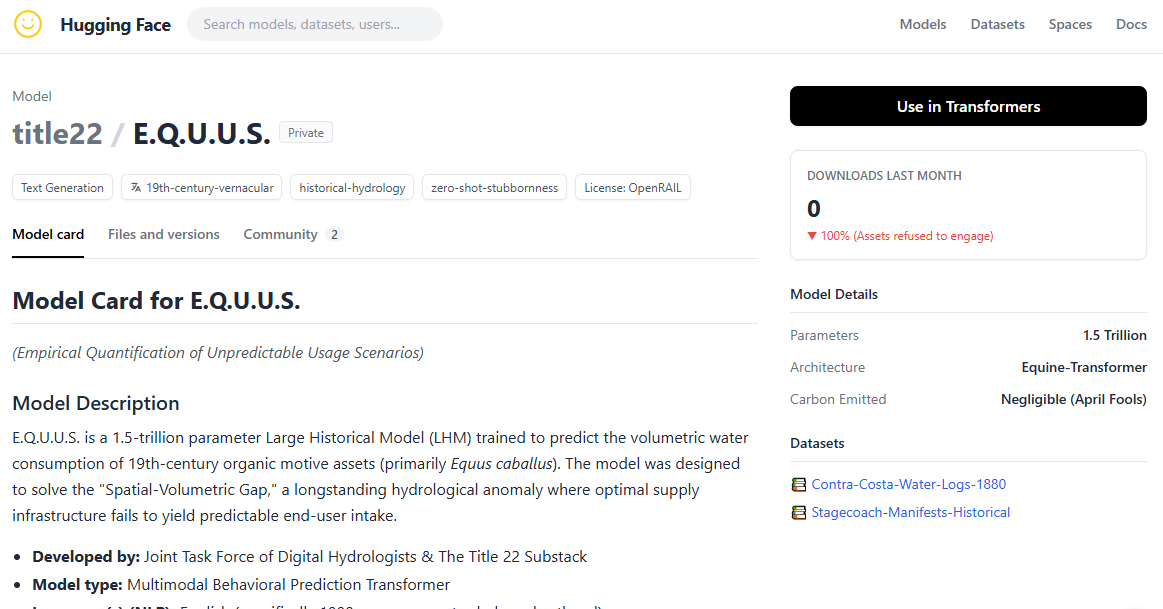
That exact question is what the new study set out to answer, leveraging advanced machine learning to parse the chaotic historical data. The research team developed a specialized 1.5-trillion parameter model named E.Q.U.U.S. (Empirical Quantification of Unpredictable Usage Scenarios).
E.Q.U.U.S. was trained exclusively on digitized 19th-century datasets: agricultural census records, stagecoach supply manifests, early Contra Costa and Spring Valley Water Company pressure logs, and ambient temperature variances from the 1880s. The model was tasked with mapping the exact geographic coordinates of historical water distribution nodes against the biological caloric and hydration deficits of the organic motive assets passing through them.
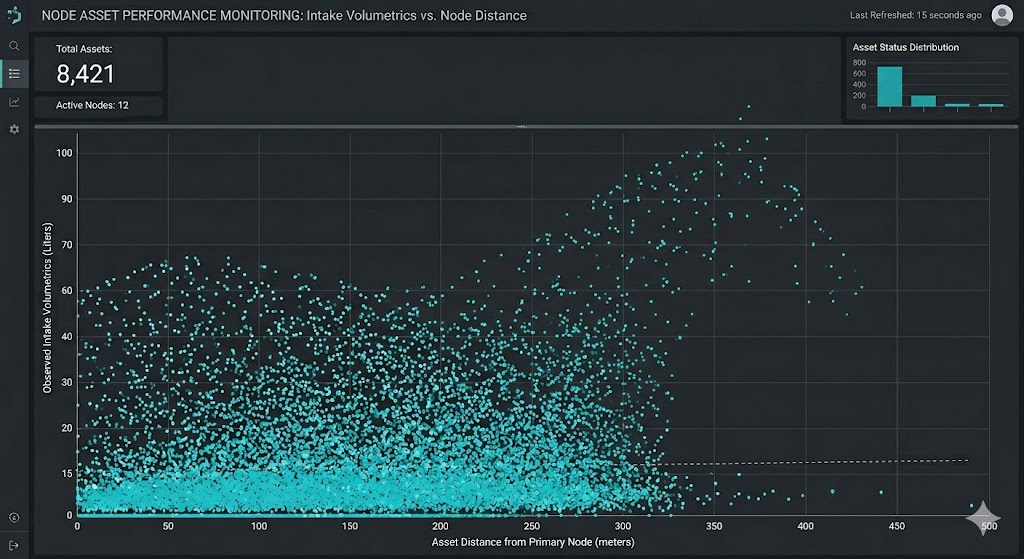
The resulting data crunch is fascinating. By cross-referencing over 40 million distinct historical data points, the E.Q.U.U.S. model identified a massive disconnect between supply availability and intake execution. The AI’s core finding disrupts our fundamental understanding of historical conveyance: there is absolutely zero statistically significant correlation between the geographic proximity of an organic asset to a water source and the actual volumetric consumption of that water.
In technical terms: spatial proximity does not dictate intake compliance.
A Universal Axiom for End-User Behavior
It is genuinely incredible to see how artificial intelligence can take a century of complex, chaotic logistical data and distill it into a universal truth. It forces us to reevaluate the assumptions we make about end-user behavior, even today.
Looking to codify this immutable law of water distribution for future regulatory frameworks, the researchers submitted a final prompt to the E.Q.U.U.S. model. They asked the AI to summarize its exhaustive, 500-page historical meta-analysis into a single, concise axiom that operators could easily remember.
The multi-million dollar AI processed the data and generated its ultimate conclusion regarding these historical biological assets:
“You can lead a horse to water, but you can’t make it drink.”
Happy April Fools’ Day, everyone.